

matplotlibで日本語を使用するにはコードで明示的に指定してあげるか、
設定ファイルのフォント設定を変更してあげる必要があります。
(じゃないと下の画像の通り、日本語がトーフ文字になってしまいます)
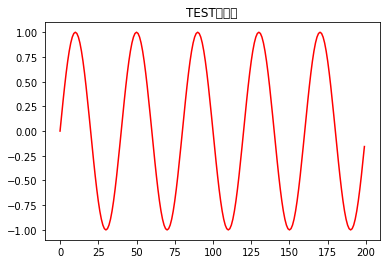
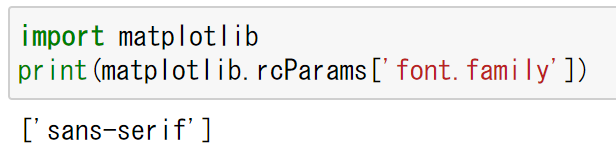
これはmatplotlibのfont.familyで設定している値が日本語に対応していないためです。
#matplotlibのfont.familyのパラメータを確認します。
import matplotlib
print(matplotlib.rcParams[‘font.family’])
今回はmatplotlibで日本語を扱えるように設定ファイルを作成する方法を紹介します。
環境
| OS | MacBook(M1) |
| Python | 3.9.1 |
| matplotlib | 3.3.3 |
matplotlibの設定ファイルを作成し、日本語を使えるようにしよう
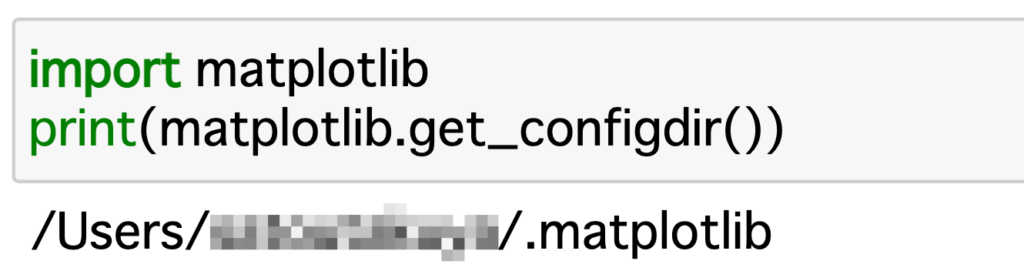
matplotlibの設定ファイルパスを確認します。
import matplotlib
print(matplotlib.get_configdir())
ターミナルを起動して設定ファイルを作るフォルダまで移動します。
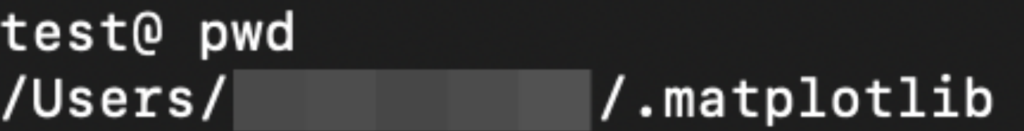
matplotlibの設定ファイルを移動したフォルダで作成します。
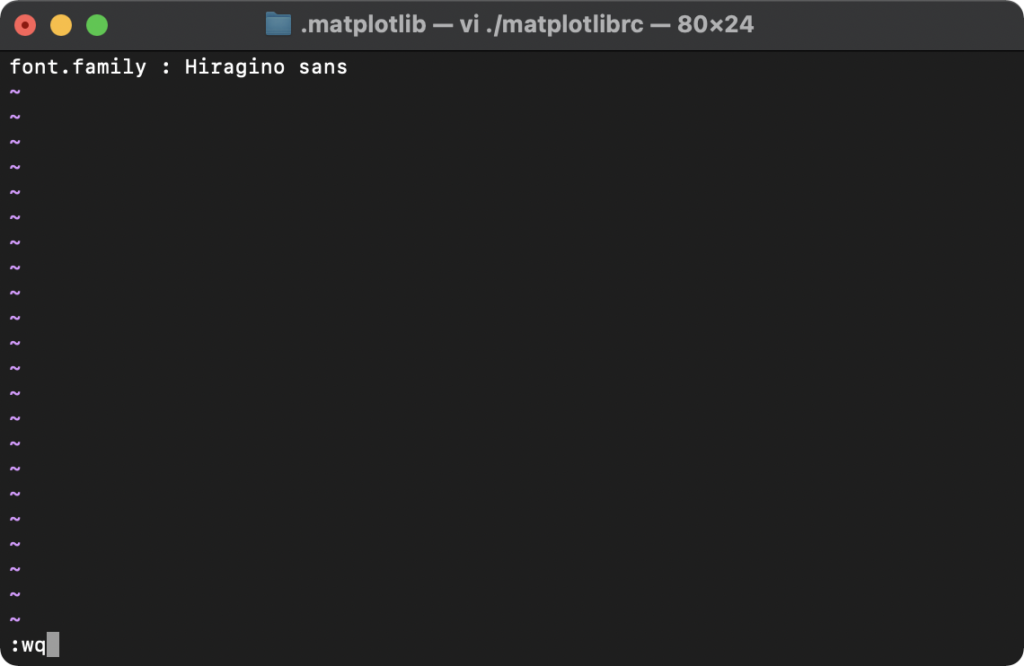
vi ./matplotlibrc
INSERTモード([I])に切り替えて、以下を入力し保存([esc]+:wq)します。
(今回はMacにデフォルトでインストールされている「Hiragino sans」を指定します)
font.family : Hiragino sans
matplotlibのフォント設定確認
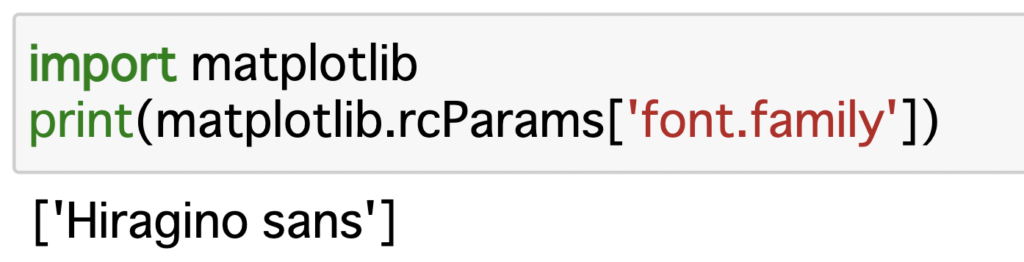
再度、以下を実行してみると作成したmatplotlibrcで指定したフォントになっているはずです。
import matplotlib
print(matplotlib.rcParams[‘font.family’])
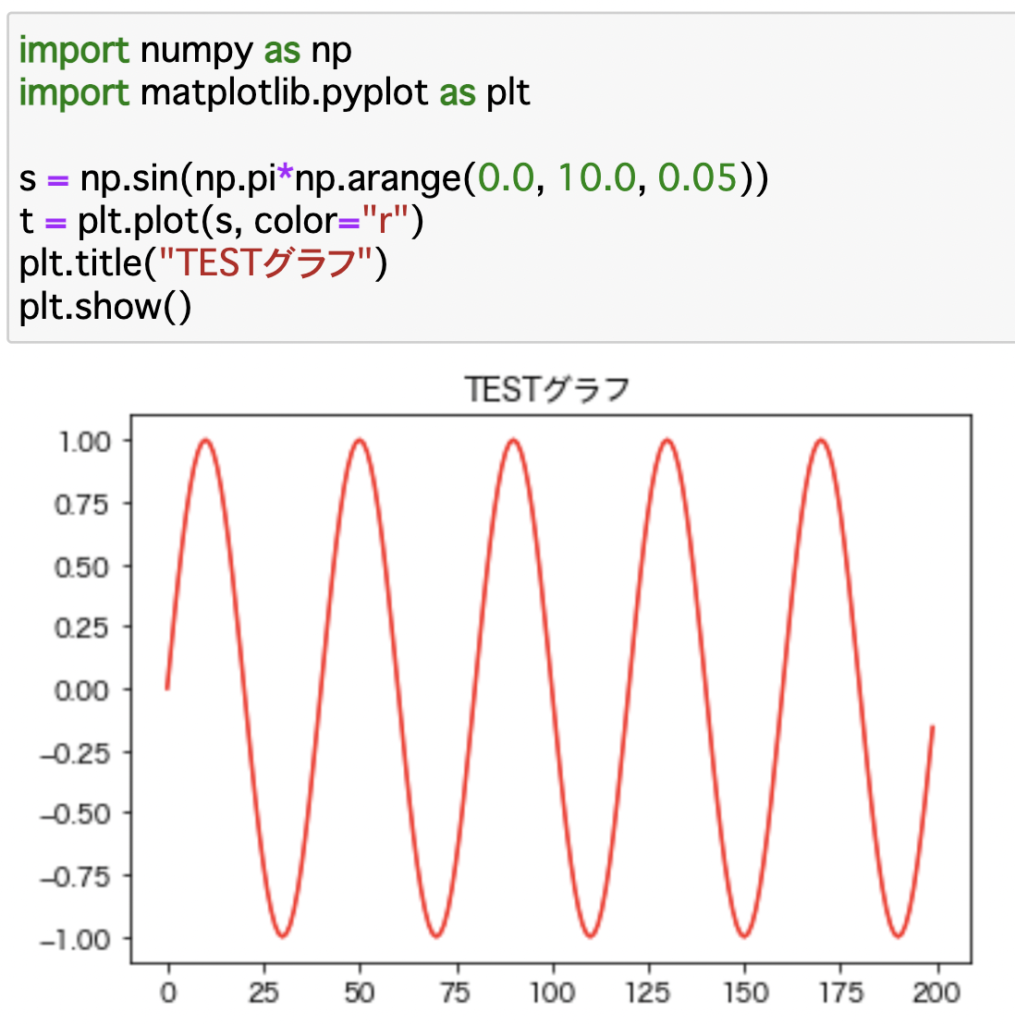
日本語が文字化けしないかサンプルコードを実行します。
import numpy as np
import matplotlib.pyplot as plt
s = np.sin(np.pi*np.arange(0.0, 10.0, 0.05))
t = plt.plot(s, color=”r”)
plt.title(“TESTグラフ”)
plt.show()


コメント